

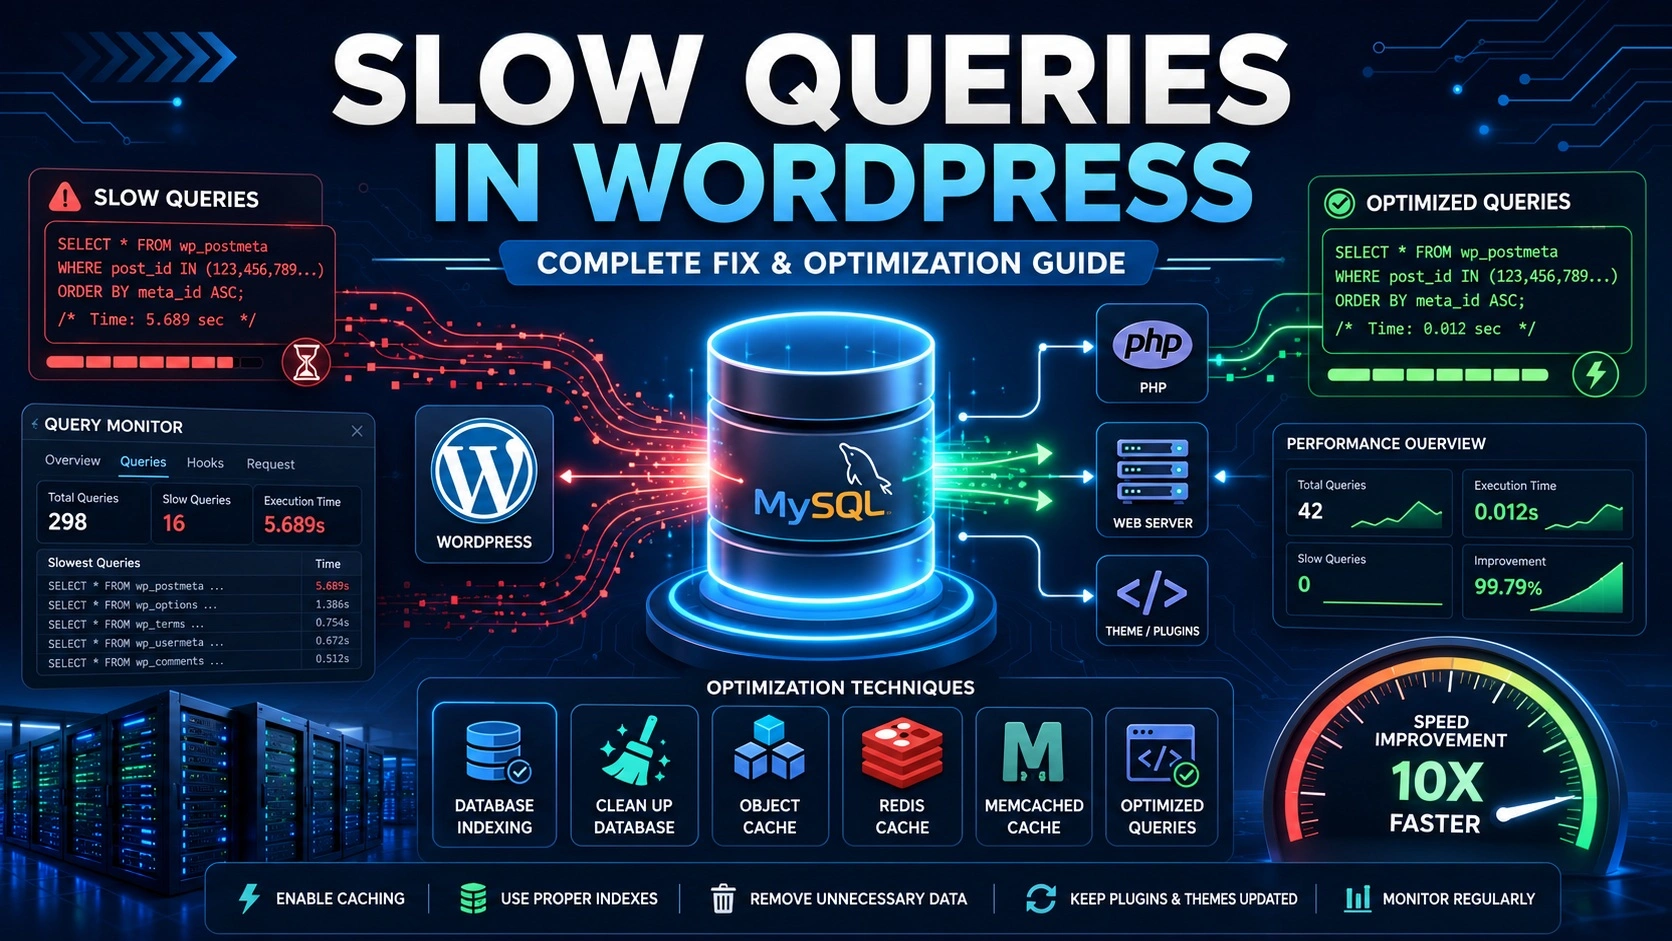
Why Your WordPress Site Is Slow and It’s Not Your Hosting
Site owner opens GTmetrix. Red numbers everywhere. Calls hosting support. Support says “upgrade your plan.” They upgrade. Numbers barely improve.
The real problem was never the server. It was the database.
WordPress is fundamentally a database application. Every page load — even a simple blog post — triggers 20–100 database queries. A typical WordPress site with a handful of plugins runs 50–150 queries per page. A poorly configured WooCommerce store can hit 300–500 queries on a product page. Each one that runs slowly compounds into the TTFB (Time to First Byte) number that makes your site feel broken.
The original article’s advice — enable slow query log, install Query Monitor, run OPTIMIZE TABLE, add one index — is where database optimization begins, not ends. This guide covers the complete picture:
- How to read a WordPress EXPLAIN and interpret every column
- The wp_options autoload problem — the most common WordPress performance killer most developers haven’t heard of
- The wp_postmeta explosion — how plugins destroy performance and how to fix it
- N+1 query detection in WordPress themes and plugins — and rewriting them
- WP_Query optimization — the right args that prevent full table scans
- Transient table bloat — and why it silently fills your database
- Custom SQL best practices for WordPress developers
- Connection pooling and persistent connections for high-traffic sites
- WooCommerce-specific query optimization
- Production MySQL configuration tuned for WordPress workloads
- A complete benchmarking methodology so you measure impact, not just apply random fixes
Part 1 — Understanding the WordPress Database Schema
You cannot optimize what you don’t understand. Here is every WordPress core table, what it stores, and what makes it slow.
WordPress Core Tables (default installation):
─────────────────────────────────────────────────────────────────────────────
Table               Rows (typical)    Primary Use               Common Problems
─────────────────────────────────────────────────────────────────────────────
wp_posts            1K–500K+          Posts, pages, CPTs        Full scans, missing indexes
wp_postmeta         5K–5M+            Post metadata (EAV)       Explosion, meta_query scans
wp_options          200–50K+          Site settings, transients Autoload bloat
wp_usermeta         1K–500K+          User metadata (EAV)       Same as wp_postmeta
wp_users            10–100K+          User accounts             Generally fast
wp_comments         100–1M+           Comments                  Full scans on post_id
wp_commentmeta      200–2M+           Comment metadata          EAV bloat
wp_terms            10–10K+           Tags, categories          Generally fast
wp_termmeta         10–50K+           Term metadata             EAV bloat
wp_term_taxonomy    10–10K+           Term/taxonomy mapping     Generally fast
wp_term_relationships 1K–5M+          Post↔term associations   Missing indexes, N+1
─────────────────────────────────────────────────────────────────────────────
EAV = Entity-Attribute-Value pattern = inherently slow at scale
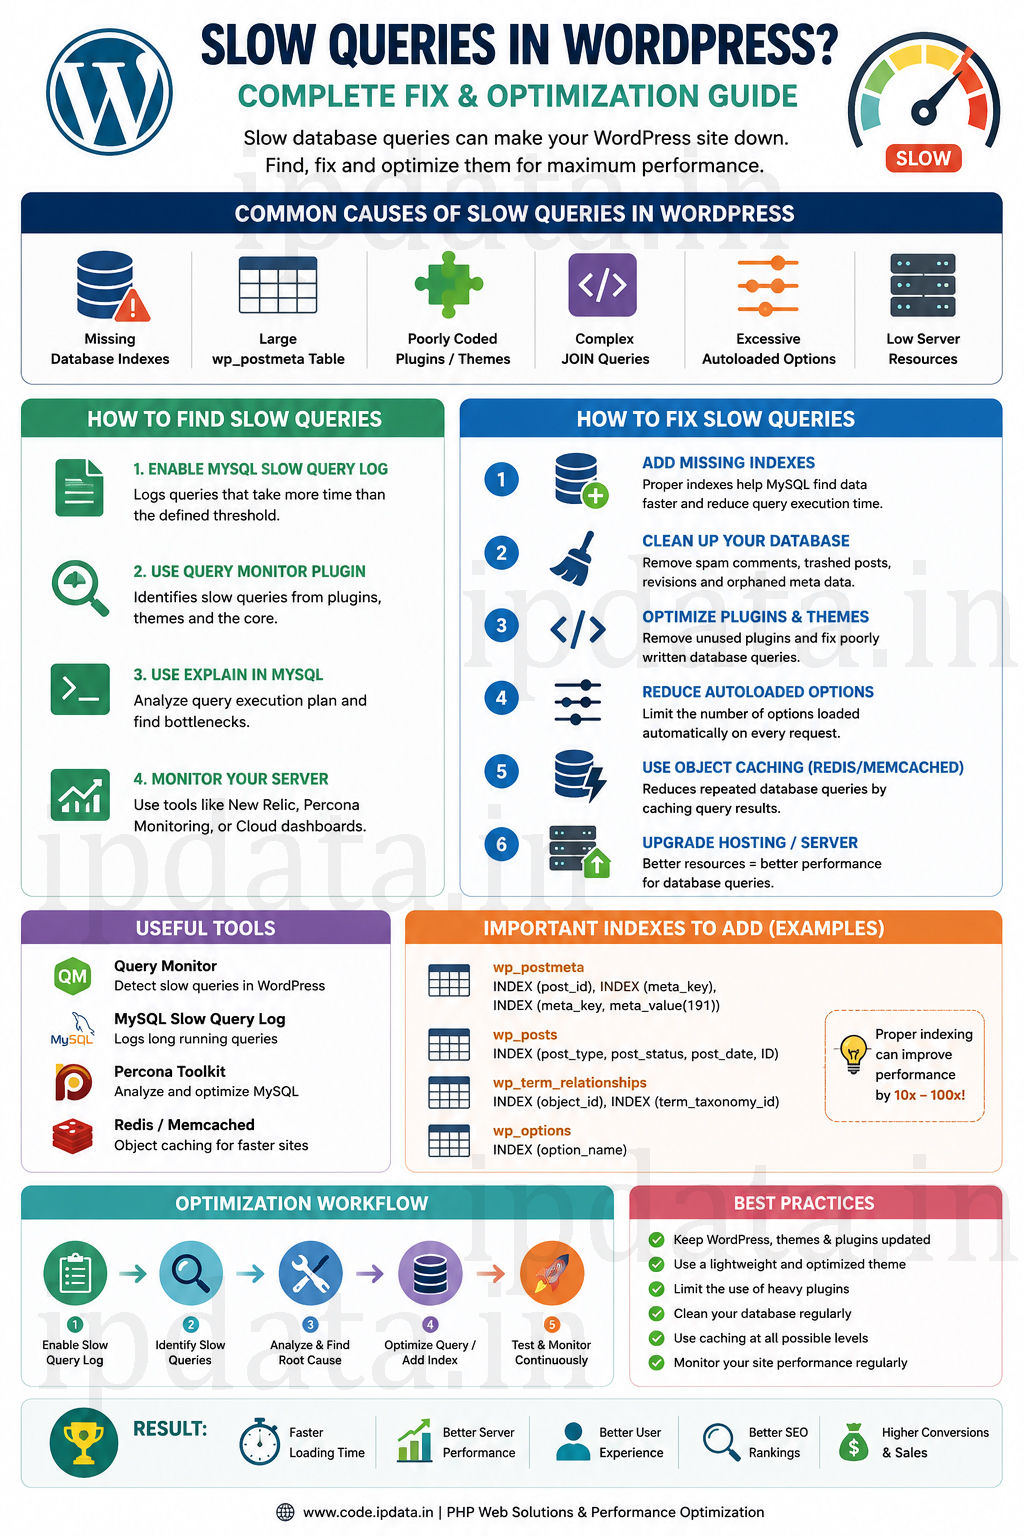
The Three Patterns That Cause 90% of WordPress Slowness
Pattern 1: The EAV Problem (wp_postmeta, wp_usermeta)
WordPress stores post metadata in a key-value table — every attribute of every post is a separate row. A WooCommerce product with 30 attributes generates 30 rows in wp_postmeta. Query that product and WordPress runs 30+ queries or one massive JOIN. Either way is slow at scale.
Pattern 2: The Autoload Explosion (wp_options)
Every WordPress option can be set to autoload=yes. WordPress loads ALL autoloaded options in a single query on every page request and keeps them in memory. When plugins add their settings with autoload=yes (which is the default), this single query can balloon to loading 3–10MB of data into memory before serving a single request.
Pattern 3: The Full Table Scan (missing indexes)
WordPress queries often use WHERE clauses on columns that have no index. MySQL reads every single row looking for matches — a full table scan. On a wp_postmeta table with 2 million rows, a single unindexed query can take 2–3 seconds.
Part 2 — The Diagnostic Workflow: Finding What’s Actually Slow
Step 1: Enable MySQL Slow Query Log with the Right Configuration
The original article shows the minimum config. Here’s the complete, useful configuration:
# /etc/mysql/mysql.conf.d/mysqld.cnf (Ubuntu/Debian)
# /etc/my.cnf (CentOS/RHEL)
# C:\xampp\mysql\bin\my.ini (Windows XAMPP)

[mysqld]

# ── Slow Query Log ──────────────────────────────────────────────────────────

# Enable slow query logging
slow_query_log = 1
slow_query_log_file = /var/log/mysql/slow.log

# Log queries taking longer than this many seconds
# Start at 1 second for initial discovery
# Lower to 0.1 (100ms) once you've fixed the 1+ second queries
long_query_time = 1

# CRITICAL: Also log queries not using indexes (catches hidden slow queries)
log_queries_not_using_indexes = 1

# Don't flood the log with fast administrative queries
min_examined_row_limit = 100

# Limit how many queries per minute can be logged (prevents log explosion)
log_throttle_queries_not_using_indexes = 10

# Include hostname in log (useful for multi-server setups)
log_short_format = 0
# Restart MySQL to apply:
sudo systemctl restart mysql

# Verify it's working:
mysql -u root -p -e "SHOW VARIABLES LIKE 'slow_query%';"
mysql -u root -p -e "SHOW VARIABLES LIKE 'long_query_time';"

# Watch the slow query log in real time:
sudo tail -f /var/log/mysql/slow.log

# After accumulating some queries, analyse with mysqldumpslow:
# Top 20 slowest queries by total time:
mysqldumpslow -s t -t 20 /var/log/mysql/slow.log

# Top 20 by number of occurrences:
mysqldumpslow -s c -t 20 /var/log/mysql/slow.log

# More detailed analysis (requires percona-toolkit):
sudo apt install percona-toolkit
pt-query-digest /var/log/mysql/slow.log | head -500
Step 2: Using Query Monitor Properly
Query Monitor is a WordPress plugin but using it effectively requires knowing what to look at beyond “slow queries.”
Query Monitor Dashboard Panels (and what to look for):
─────────────────────────────────────────────────────────────────────────────
Panel                  What to Look For
─────────────────────────────────────────────────────────────────────────────
Database Queries       Total query count (> 100 = investigate)
                       Total query time (> 200ms = investigate)
                       Individual slow queries (sorted by time)
                       "Duplicate queries" count (N+1 indicator)
                       Caller column (shows which plugin/theme made each query)

Database Queries       Queries with "type = ALL" in EXPLAIN column
(EXPLAIN column)       These are doing full table scans

Hooks & Actions        Which actions take the most time
                       helps identify plugin bottlenecks beyond SQL

PHP Errors             Silent errors that cause code to retry operations

Scripts & Styles       Scripts registered/enqueued counts
                       Helps identify plugin overhead

Environment            PHP version, MySQL version, memory usage
─────────────────────────────────────────────────────────────────────────────
Install and configure Query Monitor for development:
# Install via WP-CLI:
wp plugin install query-monitor --activate --path=/var/www/html

# Query Monitor only shows data when you're logged in as admin
# For capturing queries from non-logged-in visits, add to wp-config.php:
define('QM_SHOW_ALL_REQUESTS', true);    # Shows all request types
define('QM_ENABLE_CAPS_PANEL', true);    # Capabilities panel

# Save Query Monitor data to a log file (for batch analysis):
define('QM_LOG_FILE', '/tmp/query-monitor.log');
What a problematic Query Monitor output looks like:
Database Queries (Bad example — actual data from a WooCommerce site):

Total queries:   487          ← Should be under 100 for a product page
Total time:      2,840ms      ← Should be under 200ms
Duplicate queries: 124        ← 124 duplicate queries = N+1 problem

Top slow queries:
Time     Query
─────────────────────────────────────────────────────────────────────────────
832ms    SELECT * FROM wp_postmeta WHERE post_id IN (1,2,3,...,47) ...
         ↑ N+1: 47 separate postmeta lookups being done sequentially

448ms    SELECT option_value FROM wp_options WHERE option_name = 'alloptions'
         ↑ Autoload bloat: wp_options too large to cache efficiently

312ms    SELECT p.*, t.*, tt.* FROM wp_posts p
         JOIN wp_term_relationships tr ON ...
         JOIN wp_terms t ON ...
         WHERE p.post_type = 'product' AND p.post_status = 'publish'
         ↑ Missing index on wp_term_relationships

241ms    SELECT * FROM wp_posts WHERE post_content LIKE '%sale%'
         ↑ LIKE with leading wildcard = full table scan, unfixable with index
─────────────────────────────────────────────────────────────────────────────
Step 3: Reading EXPLAIN Output for WordPress Queries
EXPLAIN is the most powerful diagnostic tool for WordPress database issues. Here’s how to read it:
-- Run EXPLAIN on any query you find in Query Monitor or slow query log:
EXPLAIN SELECT * FROM wp_posts
WHERE post_type = 'product'
  AND post_status = 'publish'
ORDER BY post_date DESC;
Understanding the EXPLAIN output columns:
EXPLAIN result:
┌────┬─────────────┬──────┬──────────┬──────────────┬───────┬──────────┬──────────────────┬──────────┐
│ id │ select_type │ type │ possible │ key          │ rows  │ filtered │ Extra            │ ← Focus on│
│    │             │      │ _keys    │              │       │          │                  │ these 4  │
├────┼─────────────┼──────┼──────────┼──────────────┼───────┼──────────┼──────────────────┤          │
│  1 │ SIMPLE      │ ref  │ type_sta │ type_status_ │  1240 │   100.00 │ Using index cond │ ←        │
│    │             │      │ tus_date │ date         │       │          │                  │          │
└────┴─────────────┴──────┴──────────┴──────────────┴───────┴──────────┴──────────────────┴──────────┘

KEY COLUMNS TO UNDERSTAND:
──────────────────────────────────────────────────────────────────────────────────
Column          What it means                    What you want
──────────────────────────────────────────────────────────────────────────────────
type            How MySQL accesses the table:

                const   = single row by PK        ✅ Best possible
                eq_ref  = single row per join     ✅ Excellent
                ref     = multiple rows by index  ✅ Good
                range   = index range scan        ✅ Acceptable
                index   = full index scan         ⚠️ Moderate — full index
                ALL     = full table scan         ❌ WORST — never want this

key             Which index is being used         NULL = no index = bad
rows            Estimated rows MySQL will examine Lower = better
Extra:
  "Using index condition" = index pushdown        ✅ Good
  "Using where"           = filtering after fetch ⚠️ OK with index
  "Using filesort"        = sorting in memory     ⚠️ Means no sort index
  "Using temporary"       = temp table created    ❌ Expensive
  "Full table scan"       = reading entire table  ❌ Needs an index
──────────────────────────────────────────────────────────────────────────────────
EXPLAIN practical examples for WordPress:
-- Example 1: Common WP_Query — is it using the right index?
EXPLAIN SELECT SQL_NO_CACHE ID, post_title
FROM wp_posts
WHERE post_type = 'post'
  AND post_status = 'publish'
ORDER BY post_date DESC
LIMIT 10;

-- Good result: type=ref, key=type_status_date
-- Bad result: type=ALL, key=NULL → Add composite index

-- Example 2: wp_postmeta lookup — always check this
EXPLAIN SELECT meta_value
FROM wp_postmeta
WHERE post_id = 123
  AND meta_key = '_price';

-- Good: type=ref, key=post_id
-- Note: WordPress includes a post_id index but NOT a composite (post_id, meta_key) index

-- Example 3: Taxonomy query — common source of slowness
EXPLAIN SELECT p.ID, p.post_title
FROM wp_posts p
INNER JOIN wp_term_relationships tr ON p.ID = tr.object_id
INNER JOIN wp_term_taxonomy tt ON tr.term_taxonomy_id = tt.term_taxonomy_id
WHERE tt.taxonomy = 'category'
  AND tt.term_id = 5
  AND p.post_status = 'publish'
  AND p.post_type = 'post';

-- Check: Does tr.object_id have an index? (It should, by default in WP)
-- If rows count for wp_term_relationships is very high → performance issue
Part 3 — The wp_options Autoload Problem (The Most Underdiagnosed Issue)
The original article mentions cleaning up autoloaded options. Here is the complete picture of why this matters and exactly how to fix it.
Why Autoload Kills WordPress Performance
Every WordPress page load executes this query before anything else:
-- WordPress runs this on EVERY page load (core/class-wp-object-cache.php):
SELECT option_name, option_value
FROM wp_options
WHERE autoload = 'yes';
This loads ALL autoloaded options into memory as $_wp_using_ext_object_cache. On a clean WordPress installation, this returns ~300 rows totalling ~20KB — fine.
But on a typical site with 20–30 plugins, each storing settings with autoload=yes:
Clean WordPress:     300 rows,    20KB
5 plugins added:     850 rows,   180KB
15 plugins added:   2,400 rows, 1.2MB
25+ plugins:        5,000 rows, 4.8MB   ← CRITICAL: loads 4.8MB every request
WooCommerce heavy:  8,000 rows, 8.5MB   ← SEVERE: 8.5MB per page load
This single query loading 4–8MB of data on every request is why many WordPress sites are slow even with caching.
Diagnosing Autoload Bloat
-- Run these in phpMyAdmin or MySQL CLI:

-- 1. How big is your autoload payload?
SELECT
    COUNT(*) AS total_options,
    SUM(LENGTH(option_value)) / 1024 / 1024 AS total_mb,
    SUM(CASE WHEN autoload = 'yes' THEN 1 ELSE 0 END) AS autoload_count,
    SUM(CASE WHEN autoload = 'yes' THEN LENGTH(option_value) ELSE 0 END) / 1024 / 1024 AS autoload_mb
FROM wp_options;

-- Target: autoload_mb should be under 1MB
-- Above 3MB = performance problem
-- Above 5MB = severe performance problem

-- 2. Which options are taking the most autoload space?
SELECT
    option_name,
    autoload,
    LENGTH(option_value) / 1024 AS size_kb,
    SUBSTRING(option_value, 1, 100) AS preview
FROM wp_options
WHERE autoload = 'yes'
ORDER BY LENGTH(option_value) DESC
LIMIT 30;

-- 3. Find all autoloaded transients (these should NEVER be autoloaded)
SELECT
    option_name,
    LENGTH(option_value) / 1024 AS size_kb
FROM wp_options
WHERE option_name LIKE '_transient_%'
  AND autoload = 'yes'
ORDER BY LENGTH(option_value) DESC
LIMIT 20;

-- 4. Find plugin-specific large autoloaded options
SELECT
    option_name,
    LENGTH(option_value) / 1024 AS size_kb
FROM wp_options
WHERE autoload = 'yes'
  AND option_name NOT IN (
    'siteurl', 'blogname', 'blogdescription', 'admin_email', 'blogpublic',
    'default_role', 'permalink_structure', 'template', 'stylesheet',
    'active_plugins', 'sidebars_widgets', 'widget_search', 'wp_user_roles',
    'cron', 'rewrite_rules', 'timezone_string', 'date_format', 'time_format'
  )
ORDER BY LENGTH(option_value) DESC
LIMIT 20;
The Autoload Cleanup Procedure
-- ── STEP 1: Fix autoloaded transients (always safe to do) ──────────────────
-- Transients should NEVER be autoloaded — they're temporary data
UPDATE wp_options
SET autoload = 'no'
WHERE option_name LIKE '_transient_%'
   OR option_name LIKE '_site_transient_%';

-- ── STEP 2: Delete expired transients ──────────────────────────────────────
-- Expired transient timeout markers (safe to delete):
DELETE FROM wp_options
WHERE option_name LIKE '_transient_timeout_%'
  AND option_value < UNIX_TIMESTAMP();

-- Delete the corresponding expired transient values:
DELETE FROM wp_options
WHERE option_name LIKE '_transient_%'
  AND option_name NOT LIKE '_transient_timeout_%'
  AND REPLACE(option_name, '_transient_', '_transient_timeout_') IN (
    SELECT option_name FROM (
        SELECT option_name FROM wp_options
        WHERE option_name LIKE '_transient_timeout_%'
          AND option_value < UNIX_TIMESTAMP()
    ) AS expired
  );

-- ── STEP 3: Turn off autoload for large plugin options ─────────────────────
-- IMPORTANT: Only do this after verifying the option isn't needed on every page
-- Check the preview before disabling:
SELECT option_name, LENGTH(option_value)/1024 AS kb, SUBSTRING(option_value, 1, 100) AS preview
FROM wp_options
WHERE autoload = 'yes'
  AND LENGTH(option_value) > 10240  -- Options larger than 10KB
ORDER BY LENGTH(option_value) DESC;

-- Example: Disable autoload for Yoast SEO redirect options (100KB+, not needed per request):
UPDATE wp_options SET autoload = 'no' WHERE option_name = 'wpseo-premium-redirects-base';
UPDATE wp_options SET autoload = 'no' WHERE option_name = 'wpseo-premium-redirects-export-plain';

-- ── STEP 4: Clean orphaned plugin options ──────────────────────────────────
-- Options from plugins you've deleted (safe to remove)
-- First, get the list of active plugin slugs:
-- wp option get active_plugins --format=json

-- Then find options from inactive plugins:
-- (requires knowing what each plugin's option names look like)
-- Example: clean up options from a removed analytics plugin
DELETE FROM wp_options WHERE option_name LIKE 'monsterinsights_%';
DELETE FROM wp_options WHERE option_name LIKE 'ga_google_analytics_%';
WordPress Code to Properly Register Options
<?php
/**
 * When adding plugin settings, ALWAYS specify autoload:
 * Use 'no' for settings not needed on every front-end page.
 */

// ❌ BAD: Default autoload='yes' — adds to per-request payload
add_option('my_plugin_settings', $defaults);

// ✅ GOOD: Explicitly set autoload='no' for non-critical options
add_option('my_plugin_settings', $defaults, '', 'no');

// ✅ GOOD: For options accessed on every page (truly needed per request):
add_option('my_plugin_featured_settings', $critical_defaults, '', 'yes');

// ✅ BEST: Update existing option with autoload change:
function my_plugin_fix_autoload(): void {
    global $wpdb;

    // Change autoload to 'no' for all my plugin options
    $wpdb->query(
        "UPDATE {$wpdb->options}
         SET autoload = 'no'
         WHERE option_name LIKE 'my_plugin_%'"
    );
}
add_action('admin_init', 'my_plugin_fix_autoload');

// ✅ PROPER: Using update_option() with autoload parameter (WP 4.2+):
update_option('my_plugin_settings', $new_value, false); // false = no autoload
Part 4 — The wp_postmeta Explosion Problem
wp_postmeta is the most common source of database slowness on WordPress sites with WooCommerce, ACF (Advanced Custom Fields), or custom development.
Understanding the EAV Problem
Normal relational table for a product:
┌────┬──────────┬───────┬─────────────────┬────────────┐
│ id │ title    │ price │ stock_quantity  │ sku        │
├────┼──────────┼───────┼─────────────────┼────────────┤
│  1 │ T-Shirt  │ 19.99 │ 150             │ TSHIRT-001 │
└────┴──────────┴───────┴─────────────────┴────────────┘
1 row, fast to retrieve, easy to index

WordPress EAV (Entity-Attribute-Value) in wp_postmeta:
┌──────────┬──────────────────────┬──────────────┐
│ post_id  │ meta_key             │ meta_value   │
├──────────┼──────────────────────┼──────────────┤
│       1  │ _price               │ 19.99        │
│       1  │ _stock_quantity      │ 150          │
│       1  │ _sku                 │ TSHIRT-001   │
│       1  │ _regular_price       │ 24.99        │
│       1  │ _sale_price          │ 19.99        │
│       1  │ _weight              │ 0.5          │
│       1  │ _length              │ 30           │
│       1  │ _width               │ 20           │
│       1  │ _height              │ 5            │
│       1  │ _manage_stock        │ yes          │
│       1  │ _backorders          │ no           │
│       1  │ _low_stock_amount    │ 5            │
│       1  │ _virtual             │ no           │
│       1  │ _downloadable        │ no           │
│       1  │ thumbnail_id         │ 42           │
│       1  │ _product_image_gallery│ 43,44,45   │
│  ...30+ more rows...                            │
└──────────┴──────────────────────┴──────────────┘
30+ rows per product, requires JOINs or multiple queries
Diagnosing wp_postmeta Size
-- How many rows does wp_postmeta have?
SELECT
    COUNT(*) AS total_rows,
    COUNT(DISTINCT post_id) AS distinct_posts,
    COUNT(*) / COUNT(DISTINCT post_id) AS avg_meta_per_post,
    (SELECT COUNT(*) FROM wp_posts WHERE post_type = 'product') AS total_products
FROM wp_postmeta;

-- Find the biggest meta_key consumers:
SELECT
    meta_key,
    COUNT(*) AS row_count,
    AVG(LENGTH(meta_value)) AS avg_value_size_bytes,
    MAX(LENGTH(meta_value)) AS max_value_size_bytes
FROM wp_postmeta
GROUP BY meta_key
ORDER BY row_count DESC
LIMIT 30;

-- Find orphaned postmeta (rows for deleted posts):
-- These are wasted space and slow down queries
SELECT COUNT(*) AS orphaned_rows
FROM wp_postmeta pm
LEFT JOIN wp_posts p ON p.ID = pm.post_id
WHERE p.ID IS NULL;

-- Delete orphaned postmeta (BACKUP FIRST):
DELETE pm FROM wp_postmeta pm
LEFT JOIN wp_posts p ON p.ID = pm.post_id
WHERE p.ID IS NULL;
Critical Indexes for wp_postmeta
WordPress’s default indexes on wp_postmeta are insufficient for most real-world queries:
-- Check existing indexes on wp_postmeta:
SHOW INDEX FROM wp_postmeta;
-- Default indexes: meta_id (PK), post_id, meta_key

-- The DEFAULT meta_key index only covers the first 191 characters
-- For queries filtering on BOTH post_id AND meta_key (most common pattern):
-- MySQL uses post_id index but still scans all meta for that post

-- ── ADD COMPOSITE INDEX for common WordPress queries ────────────────────────
-- This dramatically speeds up queries like:
-- WHERE post_id = 123 AND meta_key = '_price'
-- WHERE meta_key = '_price' ORDER BY meta_value+0

-- Index 1: Composite (post_id + meta_key) for per-post attribute lookups
ALTER TABLE wp_postmeta
ADD INDEX idx_post_meta_key (post_id, meta_key(32));

-- Index 2: For meta_value lookups (used in WP_Query meta_compare queries)
-- Only add if you have queries filtering by meta_value
-- ALTER TABLE wp_postmeta ADD INDEX idx_meta_value (meta_key(32), meta_value(32));

-- ── Verify the new index is being used ─────────────────────────────────────
EXPLAIN SELECT meta_value
FROM wp_postmeta
WHERE post_id = 1 AND meta_key = '_price';
-- Should now show: key = idx_post_meta_key
Rewriting Inefficient WP_Query meta_query
<?php
// ❌ SLOW: meta_query with complex comparisons causes full postmeta scans
$query = new WP_Query([
    'post_type'  => 'product',
    'meta_query' => [
        'relation' => 'AND',
        [
            'key'     => '_price',
            'value'   => [10, 100],
            'type'    => 'NUMERIC',
            'compare' => 'BETWEEN',
        ],
        [
            'key'     => '_stock_status',
            'value'   => 'instock',
            'compare' => '=',
        ],
        [
            'key'     => '_featured',
            'value'   => 'yes',
            'compare' => '=',
        ],
    ],
]);
// This generates: 3 JOINs on wp_postmeta, each scanning thousands of rows

// ✅ BETTER: Use meta_query orderby with a named clause for the most selective filter
$query = new WP_Query([
    'post_type'   => 'product',
    'post_status' => 'publish',
    'meta_query'  => [
        'relation'        => 'AND',
        'price_clause'    => [   // Named clauses allow orderby
            'key'     => '_price',
            'value'   => [10, 100],
            'type'    => 'NUMERIC',
            'compare' => 'BETWEEN',
        ],
        'stock_clause'    => [
            'key'     => '_stock_status',
            'value'   => 'instock',
        ],
    ],
    'orderby'     => ['price_clause' => 'ASC'],
]);

// ✅ BEST FOR HIGH TRAFFIC: Custom SQL with pre-built index
// Use wpdb->prepare() for security, direct SQL for performance
global $wpdb;

$products = $wpdb->get_results(
    $wpdb->prepare(
        "SELECT DISTINCT p.ID, p.post_title,
                price_meta.meta_value AS price,
                stock_meta.meta_value AS stock_status
         FROM {$wpdb->posts} p
         INNER JOIN {$wpdb->postmeta} price_meta
             ON price_meta.post_id = p.ID
             AND price_meta.meta_key = '_price'
             AND price_meta.meta_value BETWEEN %f AND %f
         INNER JOIN {$wpdb->postmeta} stock_meta
             ON stock_meta.post_id = p.ID
             AND stock_meta.meta_key = '_stock_status'
             AND stock_meta.meta_value = %s
         WHERE p.post_type = 'product'
           AND p.post_status = 'publish'
         ORDER BY price_meta.meta_value + 0 ASC
         LIMIT %d OFFSET %d",
        10.00,     // min price
        100.00,    // max price
        'instock', // stock status
        20,        // limit
        0          // offset
    )
);
Part 5 — N+1 Query Detection and Elimination
The N+1 problem is the most common WordPress performance issue that Query Monitor makes visible through its “duplicate queries” count.
What N+1 Looks Like in WordPress
<?php
// ❌ THE N+1 PATTERN — runs 1 query to get posts, then N queries for metadata
$posts = get_posts([
    'post_type'      => 'product',
    'posts_per_page' => 20,
    'post_status'    => 'publish',
]);

// Result: 1 query for posts
echo count($posts) . " products loaded\n";

foreach ($posts as $post) {
    // ❌ Each get_post_meta() call runs a SEPARATE database query:
    $price    = get_post_meta($post->ID, '_price', true);     // Query 2
    $sku      = get_post_meta($post->ID, '_sku', true);       // Query 3
    $stock    = get_post_meta($post->ID, '_stock_status', true); // Query 4
    // For 20 products × 3 meta keys = 60 queries!

    echo "{$post->post_title}: £{$price} (SKU: {$sku}, Stock: {$stock})\n";
}
// TOTAL: 61 queries for 20 products. For 100 products: 301 queries.
The Fix: Eager Loading with update_meta_cache()
<?php
// ✅ SOLUTION 1: update_meta_cache() — loads all postmeta in ONE query
$posts = get_posts([
    'post_type'      => 'product',
    'posts_per_page' => 20,
    'post_status'    => 'publish',
    // 'update_post_meta_cache' => true is DEFAULT — keep it on!
    // (Setting to false DISABLES this optimisation)
]);

// WordPress has already loaded ALL metadata for these posts in a single query:
// SELECT * FROM wp_postmeta WHERE post_id IN (1,2,3,...,20)
// And cached it in the object cache

foreach ($posts as $post) {
    // These now READ FROM CACHE, no database query:
    $price = get_post_meta($post->ID, '_price', true);    // From cache ✅
    $sku   = get_post_meta($post->ID, '_sku', true);      // From cache ✅
    $stock = get_post_meta($post->ID, '_stock_status', true); // From cache ✅
}
// TOTAL: 2 queries (posts + bulk postmeta).

// ✅ SOLUTION 2: Manual eager loading for custom queries
global $wpdb;

// Get post IDs first:
$post_ids = $wpdb->get_col(
    "SELECT ID FROM {$wpdb->posts}
     WHERE post_type = 'product'
       AND post_status = 'publish'
     LIMIT 20"
);

// Load all metadata in one batch:
update_postmeta_cache($post_ids);

// Now all get_post_meta() calls are served from cache:
foreach ($post_ids as $id) {
    $price = get_post_meta($id, '_price', true); // From cache
}

// ✅ SOLUTION 3: WP_Query with 'fields' parameter
// When you only need IDs (for batch operations):
$product_ids = get_posts([
    'post_type'      => 'product',
    'posts_per_page' => -1,
    'post_status'    => 'publish',
    'fields'         => 'ids', // Returns only IDs — much lighter query
]);

// Bulk load meta for all those IDs:
update_postmeta_cache($product_ids);
N+1 in Theme Templates — The Hidden Source
<?php
// ❌ COMMON N+1 IN TEMPLATES: Featured image in a loop
// If this is in a custom loop without 'update_post_thumbnail_cache':
$posts = new WP_Query([...]);
while ($posts->have_posts()) {
    $posts->the_post();
    // Each call generates a postmeta query for _thumbnail_id:
    $thumb_id = get_post_thumbnail_id(); // Database query!
    $thumb_url = wp_get_attachment_image_url($thumb_id); // Another query!
}

// ✅ FIX: Ensure thumbnail cache pre-loading
$posts = new WP_Query([
    'post_type'                => 'post',
    'posts_per_page'           => 12,
    'update_post_thumbnail_cache' => true, // ← Explicitly ensure this is on
    'update_post_meta_cache'   => true,    // ← Also ensures postmeta cache
]);

// ❌ ANOTHER COMMON N+1: get_the_terms() in a loop
while ($posts->have_posts()) {
    $posts->the_post();
    $categories = get_the_terms(get_the_ID(), 'category'); // DB query per post!
}

// ✅ FIX: Pre-cache all term relationships
$posts = new WP_Query([
    'post_type'      => 'post',
    'posts_per_page' => 12,
]);

// Pre-load all term caches for these posts:
$post_ids = wp_list_pluck($posts->posts, 'ID');
update_object_term_cache($post_ids, 'post');

// Now get_the_terms() reads from cache — no queries:
while ($posts->have_posts()) {
    $posts->the_post();
    $categories = get_the_terms(get_the_ID(), 'category'); // From cache ✅
}
Part 6 — WP_Query Optimization Patterns
WP_Query is the heart of WordPress data retrieval. These settings dramatically affect query performance.
The WP_Query Performance Settings Reference
<?php
// Performance-critical WP_Query arguments:

$optimized_query = new WP_Query([

    // ── Always specify these ───────────────────────────────────────────────

    'post_type'   => 'post',        // Always specify post_type
    'post_status' => 'publish',     // Always specify post_status
                                    // Without these, WP queries ALL types/statuses

    // ── Cache control ─────────────────────────────────────────────────────

    'cache_results'          => true,  // Cache WP_Post objects (default: true)
    'update_post_meta_cache' => true,  // Pre-load all postmeta (default: true)
    'update_post_term_cache' => true,  // Pre-load all term data (default: true)
    // Set all to false ONLY for one-time CLI/admin tasks where caching is wasteful

    // ── Use 'fields' to only get what you need ─────────────────────────────

    // 'fields' => 'ids',           // Returns array of IDs only — fastest
    // 'fields' => 'id=>parent',    // Returns id => parent pairs
    // (Omit 'fields' to get full WP_Post objects)

    // ── Pagination ─────────────────────────────────────────────────────────

    'posts_per_page' => 10,        // ALWAYS limit results
    'paged'          => 1,
    'no_found_rows'  => true,      // ← MAJOR optimization: skip SQL_CALC_FOUND_ROWS
                                   // Only use when you DON'T need pagination count
                                   // Saves a COUNT(*) query

    // ── Date queries — prefer date parameters over date_query ─────────────

    // Faster:
    'year'  => 2025,
    'month' => 9,

    // Slower (generates complex WHERE):
    // 'date_query' => [['year' => 2025, 'month' => 9]],

    // ── Taxonomy queries ───────────────────────────────────────────────────

    'category_name' => 'news',     // Faster than tax_query for categories
    // OR:
    'cat' => 5,                    // Fastest: direct category ID

    // Only use tax_query when absolutely necessary (generates JOINs):
    // 'tax_query' => [...]

    // ── Meta queries — order matters ───────────────────────────────────────

    // Put the MOST SELECTIVE condition first (fewest matching rows):
    'meta_query' => [
        [
            'key'     => '_featured',    // Few posts are featured — selective
            'value'   => 'yes',
        ],
        [
            'key'     => '_price',       // Many products have prices
            'value'   => 100,
            'compare' => '<',
            'type'    => 'NUMERIC',
        ],
    ],

    // ── Ordering ───────────────────────────────────────────────────────────

    'orderby' => 'date',           // Covered by existing post_date index ✅
    'order'   => 'DESC',

    // ❌ SLOW: Ordering by meta_value requires extra JOIN + sort
    // 'orderby'  => 'meta_value_num',
    // 'meta_key' => '_price',
    // → Use a dedicated custom table or indexed column for sorting at scale

    // ── Exclude certain post types/statuses ───────────────────────────────

    'post__not_in' => [],          // AVOID on large sites — NOT IN is slow
                                   // Use post__in instead when possible
]);
The no_found_rows Optimization
<?php
// SQL_CALC_FOUND_ROWS (generated when you need pagination count) adds ~30% overhead:

// ❌ Standard WP_Query (uses SQL_CALC_FOUND_ROWS):
$query = new WP_Query([
    'post_type'      => 'post',
    'posts_per_page' => 10,
    'paged'          => 1,
]);
// MySQL executes: SELECT SQL_CALC_FOUND_ROWS ... LIMIT 10
// Then: SELECT FOUND_ROWS()  ← extra query for total count

// ✅ When you don't need the total count:
$query = new WP_Query([
    'post_type'      => 'post',
    'posts_per_page' => 10,
    'paged'          => 1,
    'no_found_rows'  => true,  // ← Skips SQL_CALC_FOUND_ROWS
]);
// MySQL executes: SELECT ... LIMIT 10  ← one query, no total count

// ✅ Efficient pagination with custom count:
// Cache the total count separately with a longer TTL:
function get_post_count_cached(array $args): int {
    $cache_key = 'post_count_' . md5(serialize($args));
    $count     = wp_cache_get($cache_key, 'query_counts');

    if ($count === false) {
        $count_query = new WP_Query(array_merge($args, [
            'posts_per_page' => 1,
            'fields'         => 'ids',
            'no_found_rows'  => false,
        ]));
        $count = $count_query->found_posts;
        wp_cache_set($cache_key, $count, 'query_counts', 300); // Cache 5 min
    }

    return $count;
}
Part 7 — Transient Bloat: The Silent Database Killer
Transients are WordPress’s temporary data storage. They’re supposed to be temporary — but on sites without a persistent object cache (Redis/Memcached), they’re stored in wp_options and accumulate into gigabytes of waste.
The Transient Problem
-- How many transients does your site have?
SELECT
    COUNT(*) AS transient_count,
    SUM(LENGTH(option_value)) / 1024 / 1024 AS total_mb,
    SUM(CASE WHEN option_name LIKE '_transient_timeout_%'
             AND option_value < UNIX_TIMESTAMP()
        THEN 1 ELSE 0 END) AS expired_count
FROM wp_options
WHERE option_name LIKE '_transient_%';

-- A site with persistent object cache (Redis): 5–20 transients (stored in Redis)
-- A site WITHOUT persistent cache: 500–50,000 transients (stored in wp_options!)
-- Expired transients accumulate because WordPress only cleans them up
-- lazily (when they're accessed, not on a schedule)
Complete Transient Cleanup
<?php
/**
 * Transient Cleanup Script
 * Run via WP-CLI: wp eval-file clean-transients.php
 */

global $wpdb;

// ── Delete expired transients ──────────────────────────────────────────────
echo "Finding expired transients...\n";

// Get IDs of expired timeout markers:
$expired_timeouts = $wpdb->get_col(
    "SELECT option_name FROM {$wpdb->options}
     WHERE option_name LIKE '_transient_timeout_%'
       AND option_value < " . time()
);

echo "Expired transients found: " . count($expired_timeouts) . "\n";

$deleted = 0;
foreach ($expired_timeouts as $timeout_key) {
    // Get the corresponding transient key:
    $transient_key = str_replace('_transient_timeout_', '_transient_', $timeout_key);

    $wpdb->delete($wpdb->options, ['option_name' => $timeout_key]);
    $wpdb->delete($wpdb->options, ['option_name' => $transient_key]);
    $deleted += 2;
}

echo "Deleted {$deleted} rows (expired transients + their timeouts)\n";

// ── Delete orphaned transients (no matching timeout) ──────────────────────
$orphaned = $wpdb->query(
    "DELETE t FROM {$wpdb->options} t
     LEFT JOIN {$wpdb->options} tt
         ON tt.option_name = REPLACE(t.option_name, '_transient_', '_transient_timeout_')
     WHERE t.option_name LIKE '_transient_%'
       AND t.option_name NOT LIKE '_transient_timeout_%'
       AND tt.option_id IS NULL"
);
echo "Deleted {$orphaned} orphaned transients\n";

// ── Show current transient stats ──────────────────────────────────────────
$stats = $wpdb->get_row(
    "SELECT COUNT(*) AS count,
            SUM(LENGTH(option_value)) / 1024 / 1024 AS mb
     FROM {$wpdb->options}
     WHERE option_name LIKE '_transient_%'"
);
echo "Remaining transients: {$stats->count} ({$stats->mb} MB)\n";
Automating Transient Cleanup
<?php
/**
 * Add to functions.php or a site-specific plugin.
 * Schedules weekly transient cleanup.
 */
function schedule_transient_cleanup(): void {
    if (!wp_next_scheduled('cleanup_expired_transients')) {
        wp_schedule_event(time(), 'daily', 'cleanup_expired_transients');
    }
}
add_action('wp', 'schedule_transient_cleanup');

add_action('cleanup_expired_transients', function(): void {
    global $wpdb;

    $deleted = $wpdb->query(
        "DELETE t FROM {$wpdb->options} t
         JOIN {$wpdb->options} tt
             ON tt.option_name = REPLACE(t.option_name, '_transient_', '_transient_timeout_')
         WHERE t.option_name LIKE '_transient_%'
           AND t.option_name NOT LIKE '_transient_timeout_%'
           AND tt.option_value < UNIX_TIMESTAMP()"
    );

    if ($deleted > 0) {
        error_log("[Transient Cleanup] Deleted {$deleted} expired transient rows");
    }
});

// ── The permanent solution: Add a persistent object cache ─────────────────
// With Redis/Memcached, transients are stored in memory, never in wp_options.
// This completely eliminates the transient bloat problem.

// Install Redis:
// sudo apt install redis-server php8.3-redis

// Install Redis Object Cache plugin:
// wp plugin install redis-cache --activate

// In wp-config.php:
// define('WP_REDIS_HOST', '127.0.0.1');
// define('WP_REDIS_PORT', 6379);
// define('WP_REDIS_DATABASE', 0);

// Enable via WP-CLI:
// wp redis enable
Part 8 — Custom SQL Best Practices for WordPress Developers
When you need to write custom queries, use wpdb correctly to avoid both security issues and performance problems.
<?php
global $wpdb;

// ── SECURITY: Always use $wpdb->prepare() for user-supplied values ─────────

// ❌ DANGEROUS — SQL injection vulnerability:
$status = $_GET['status'];
$posts  = $wpdb->get_results("SELECT * FROM wp_posts WHERE post_status = '$status'");

// ✅ SAFE — Use prepare():
$status = sanitize_key($_GET['status'] ?? 'publish');
$posts  = $wpdb->get_results(
    $wpdb->prepare(
        "SELECT ID, post_title, post_date FROM {$wpdb->posts}
         WHERE post_status = %s
           AND post_type = %s
         LIMIT %d",
        $status,
        'post',
        20
    )
);

// ── PERFORMANCE: Use the right wpdb method ─────────────────────────────────

// get_results() — multiple rows, array of objects or arrays
$products = $wpdb->get_results(
    "SELECT ID, post_title FROM {$wpdb->posts}
     WHERE post_type = 'product' AND post_status = 'publish'
     LIMIT 10",
    ARRAY_A  // ARRAY_A = assoc arrays, OBJECT = objects (default)
);

// get_row() — single row
$product = $wpdb->get_row(
    $wpdb->prepare(
        "SELECT ID, post_title FROM {$wpdb->posts} WHERE ID = %d",
        42
    )
);

// get_col() — single column, array of values
$product_ids = $wpdb->get_col(
    "SELECT ID FROM {$wpdb->posts}
     WHERE post_type = 'product'
       AND post_status = 'publish'"
);

// get_var() — single value (fastest for COUNT, SUM, MAX etc.)
$product_count = $wpdb->get_var(
    "SELECT COUNT(*) FROM {$wpdb->posts}
     WHERE post_type = 'product'
       AND post_status = 'publish'"
);

// ── PERFORMANCE: Use wpdb caching ─────────────────────────────────────────

// wpdb has a built-in query cache for the current request:
// But it's per-request only and grows unboundedly

// For expensive queries, use WordPress object cache:
function get_products_cached(int $limit = 20): array {
    $cache_key = "products_list_{$limit}";
    $cached    = wp_cache_get($cache_key, 'products');

    if ($cached !== false) {
        return $cached;
    }

    global $wpdb;
    $products = $wpdb->get_results(
        $wpdb->prepare(
            "SELECT p.ID, p.post_title, pm.meta_value AS price
             FROM {$wpdb->posts} p
             LEFT JOIN {$wpdb->postmeta} pm
                 ON pm.post_id = p.ID AND pm.meta_key = '_price'
             WHERE p.post_type = 'product'
               AND p.post_status = 'publish'
             ORDER BY p.post_date DESC
             LIMIT %d",
            $limit
        ),
        ARRAY_A
    );

    wp_cache_set($cache_key, $products, 'products', 300); // Cache 5 minutes
    return $products;
}

// ── PERFORMANCE: Suppress wpdb errors in production ──────────────────────
// wpdb stores the last query result — can consume memory on bulk operations

// For bulk inserts, use insert() with suppress_errors:
$wpdb->suppress_errors(true);

foreach ($large_dataset as $row) {
    $wpdb->insert(
        $wpdb->posts,
        [
            'post_title'   => $row['title'],
            'post_status'  => 'publish',
            'post_type'    => 'post',
            'post_date'    => current_time('mysql'),
        ],
        ['%s', '%s', '%s', '%s']
    );
}

$wpdb->suppress_errors(false);

// ── PERFORMANCE: Flush wpdb cache during bulk operations ──────────────────
// wpdb caches query results — during bulk operations, clear it periodically:
for ($i = 0; $i < count($large_dataset); $i++) {
    // ... process row ...

    if ($i % 100 === 0) {
        $wpdb->flush(); // Clear query cache to prevent memory exhaustion
    }
}
Part 9 — WordPress-Specific MySQL Configuration
The right MySQL configuration for a WordPress workload differs from generic MySQL tuning.
# /etc/mysql/mysql.conf.d/mysqld.cnf
# Optimized for WordPress (InnoDB, OLTP, many small queries)

[mysqld]

# ── InnoDB Buffer Pool (MOST IMPORTANT SETTING) ────────────────────────────
# For dedicated database server: 70–80% of total RAM
# For shared server (DB + PHP on same machine): 25–40% of RAM
# WordPress with plugins: 512MB minimum, 1GB recommended
innodb_buffer_pool_size = 1G

# Multiple buffer pool instances (reduces contention)
# One per GB of buffer pool size, max 64
innodb_buffer_pool_instances = 4

# ── InnoDB Log Settings ────────────────────────────────────────────────────
# Larger log file = better write performance for WordPress's many small writes
innodb_log_file_size = 256M
innodb_log_buffer_size = 64M

# For WordPress (moderate write load): 1 = safest, 2 = faster
innodb_flush_log_at_trx_commit = 1

# ── Query Cache (DISABLED in MySQL 8 — don't use) ─────────────────────────
# MySQL 5.7: Optional, often causes more problems than it solves for WordPress
# MySQL 8.0: Removed entirely — use application-level caching (Redis)

# ── Thread and Connection Settings ────────────────────────────────────────
# WordPress with PHP-FPM: connections = PHP-FPM max_children value
max_connections     = 200
thread_cache_size   = 50
wait_timeout        = 60    # Idle connections close after 60s
interactive_timeout = 60

# ── Table Cache ────────────────────────────────────────────────────────────
# WordPress has ~11 core tables + plugins add more
# Each unique table usage needs a file handle
table_open_cache    = 4000
table_definition_cache = 4000

# ── Temp Table Settings ────────────────────────────────────────────────────
# WordPress ORDER BY + GROUP BY queries use temp tables
tmp_table_size      = 64M
max_heap_table_size = 64M

# ── Sort and Join Buffers (per-connection — keep smaller) ─────────────────
sort_buffer_size     = 2M
join_buffer_size     = 2M
read_buffer_size     = 1M
read_rnd_buffer_size = 4M

# ── Character Set (WordPress requires utf8mb4) ─────────────────────────────
character-set-server  = utf8mb4
collation-server      = utf8mb4_unicode_ci

# ── InnoDB File Per Table ─────────────────────────────────────────────────
# Each table gets its own file — easier to reclaim space after OPTIMIZE TABLE
innodb_file_per_table = 1

# ── Slow Query Log (enable for monitoring) ────────────────────────────────
slow_query_log      = 1
slow_query_log_file = /var/log/mysql/slow.log
long_query_time     = 1
log_queries_not_using_indexes = 1
min_examined_row_limit = 100

# ── Binary Log (disable if not using replication) ─────────────────────────
# Binary logs consume disk space and add write overhead
# Disable if: no replication, no point-in-time recovery needed
# skip-log-bin   # Uncomment to disable binary logging
# OR: limit retention:
# expire_logs_days = 7

# ── Performance Schema (light monitoring overhead) ─────────────────────────
performance_schema = ON
performance_schema_max_sql_text_length = 4096
Part 10 — WooCommerce-Specific Query Optimizations
WooCommerce generates some of the most complex and slowest WordPress queries. These are the specific fixes for the most common WooCommerce performance problems.
WooCommerce Session Table Bloat
-- WooCommerce creates a custom session table that fills up rapidly:
SELECT
    COUNT(*) AS total_sessions,
    SUM(LENGTH(session_value)) / 1024 / 1024 AS total_mb,
    COUNT(CASE WHEN session_expiry < UNIX_TIMESTAMP() THEN 1 END) AS expired_sessions
FROM wp_woocommerce_sessions;

-- Delete expired sessions (safe to run anytime):
DELETE FROM wp_woocommerce_sessions
WHERE session_expiry < UNIX_TIMESTAMP();

-- Schedule this cleanup daily:
// In functions.php:
add_action('wp_scheduled_delete', function(): void {
    global $wpdb;
    $wpdb->query(
        "DELETE FROM {$wpdb->prefix}woocommerce_sessions
         WHERE session_expiry < " . time()
    );
});
WooCommerce Product Query Optimization
<?php
// ❌ SLOW: Default WooCommerce product loop can trigger hundreds of queries
// The loop_shop_per_page, sorting, and filtering without proper caching

// ✅ OPTIMIZED: WooCommerce product query with caching
function get_products_optimized(array $args = []): array {
    $defaults = [
        'status'   => 'publish',
        'type'     => 'simple',
        'limit'    => 12,
        'orderby'  => 'date',
        'order'    => 'DESC',
        'return'   => 'ids',  // Return only IDs — much lighter
    ];

    $args      = wp_parse_args($args, $defaults);
    $cache_key = 'wc_products_' . md5(serialize($args));
    $cached    = wp_cache_get($cache_key, 'woocommerce_products');

    if ($cached !== false) {
        return $cached;
    }

    $products = wc_get_products($args);
    wp_cache_set($cache_key, $products, 'woocommerce_products', 300);

    return $products;
}

// ── WooCommerce Lookup Tables ──────────────────────────────────────────────
// WooCommerce 3.6+ introduced product lookup tables to avoid wp_postmeta scans
// These must be populated and kept in sync:

// Check if lookup tables exist and are populated:
// Admin → WooCommerce → Status → Tools → Update Product Lookup Tables

// Via WP-CLI:
// wp wc tool run regenerate_product_lookup_tables --user=admin

// Lookup tables schema:
// wp_wc_product_meta_lookup   — price, stock, sku lookups
// wp_wc_order_product_lookup  — order item lookups
// wp_wc_order_stats           — order statistics
// wp_wc_customer_lookup       — customer data
// wp_wc_tax_rate_classes      — tax rate data
Add Indexes for Common WooCommerce Queries
-- WooCommerce-specific indexes to add (check first with SHOW INDEX FROM tablename):

-- Order items lookup:
ALTER TABLE wp_woocommerce_order_itemmeta
ADD INDEX IF NOT EXISTS idx_meta_key_value (meta_key(32), meta_value(32));

-- Product attribute lookup:
ALTER TABLE wp_wc_product_meta_lookup
ADD INDEX IF NOT EXISTS idx_sku (sku);

ALTER TABLE wp_wc_product_meta_lookup
ADD INDEX IF NOT EXISTS idx_price (min_price, max_price);

-- Orders by customer email (common admin query):
ALTER TABLE wp_wc_customer_lookup
ADD INDEX IF NOT EXISTS idx_email (email(100));

-- Session expiry (for cleanup queries):
ALTER TABLE wp_woocommerce_sessions
ADD INDEX IF NOT EXISTS idx_expiry (session_expiry);
Part 11 — The Object Cache Strategy
Proper WordPress caching eliminates database queries entirely for repeated reads. This is the biggest performance multiplier of all optimizations combined.
<?php
/**
 * WordPress Object Cache Best Practices
 * With Redis (requires redis-cache plugin or WP Redis)
 */

// ── Cache groups for organized invalidation ────────────────────────────────
// Use custom groups to invalidate related data together

// Storing product data:
function cache_product(int $id, array $data): void {
    wp_cache_set("product_{$id}", $data, 'products', HOUR_IN_SECONDS);
}

// Getting product data:
function get_cached_product(int $id): ?array {
    $data = wp_cache_get("product_{$id}", 'products');
    return $data !== false ? $data : null;
}

// Invalidating all products (after update):
function invalidate_product_cache(): void {
    wp_cache_delete_group('products'); // Requires Redis with group support
}

// ── Pattern: Cache + Stale While Revalidate ───────────────────────────────
function get_homepage_data(): array {
    $cache_key = 'homepage_v2';
    $group     = 'homepage';

    $data = wp_cache_get($cache_key, $group);

    if ($data === false) {
        $data = generate_homepage_data(); // Expensive operation
        wp_cache_set($cache_key, $data, $group, 5 * MINUTE_IN_SECONDS);
    }

    return $data;
}

function generate_homepage_data(): array {
    global $wpdb;

    return [
        'featured_products' => $wpdb->get_results(
            "SELECT p.ID, p.post_title, pm.meta_value AS price
             FROM {$wpdb->posts} p
             JOIN {$wpdb->postmeta} pm ON pm.post_id = p.ID
                  AND pm.meta_key = '_price'
             WHERE p.post_type = 'product'
               AND p.post_status = 'publish'
             ORDER BY p.post_date DESC
             LIMIT 8",
            ARRAY_A
        ),
        'recent_posts' => get_posts([
            'posts_per_page' => 5,
            'post_status'    => 'publish',
            'no_found_rows'  => true,
            'fields'         => 'ids',
        ]),
        'generated_at' => current_time('mysql'),
    ];
}

// ── Cache warming after deploys ────────────────────────────────────────────
// Add to your deployment script or a WP-CLI command:
function warm_critical_caches(): void {
    // Force regeneration of commonly accessed cached data:
    wp_cache_delete_group('homepage');
    wp_cache_delete_group('products');
    wp_cache_delete_group('menus');

    // Pre-warm:
    get_homepage_data();
    wp_get_nav_menu_items(primary_navigation());

    error_log('[Cache Warmer] Critical caches warmed.');
}

// WP-CLI command to warm caches after deployment:
// wp eval 'warm_critical_caches();'
Part 12 — Benchmarking Your Optimizations
Every change should be measured. Without benchmarks, you don’t know if your fix helped, hurt, or did nothing.
# ── Baseline Benchmark ──────────────────────────────────────────────────────

# 1. Clear all caches first (measure cold performance):
wp cache flush --path=/var/www/html

# 2. Run Apache Bench test:
ab -n 500 -c 10 -H "Cookie: wordpress_logged_in=0" \
   http://yoursite.com/ 2>&1 | tee /tmp/bench_before.txt

# Key metrics to record:
# Requests per second: ____ [#/sec]
# Time per request:    ____ [ms] (mean)
# Failed requests:     0 (any failures = problem)

# 3. Record Query Monitor stats for key pages:
# - Homepage
# - A category/archive page
# - A product page (if WooCommerce)
# - Admin → Posts list

# Record: Query count, total query time, largest query time

# ── After each optimization, re-measure ────────────────────────────────────

# 4. Run the same test:
wp cache flush --path=/var/www/html
ab -n 500 -c 10 -H "Cookie: wordpress_logged_in=0" \
   http://yoursite.com/ 2>&1 | tee /tmp/bench_after.txt

# 5. Compare:
diff /tmp/bench_before.txt /tmp/bench_after.txt

# ── Database-level benchmarking ─────────────────────────────────────────────

# Time a specific query before/after index addition:
mysql -u root -p mysite_db << 'EOF'
SET profiling = 1;
SELECT meta_value FROM wp_postmeta WHERE post_id = 1 AND meta_key = '_price';
SHOW PROFILES;
EOF

# wp-cli query timing:
time wp post list --post_type=product --post_status=publish --format=count --path=/var/www/html

# ── Ongoing monitoring ──────────────────────────────────────────────────────
# Set up a daily monitoring cron that logs key metrics:
cat > /usr/local/bin/wp-db-monitor.sh << 'SCRIPT'
#!/bin/bash
DATE=$(date +"%Y-%m-%d %H:%M")
WP_PATH="/var/www/html"

# Get slow query count (last 24 hours):
SLOW_QUERIES=$(grep -c "Query_time" /var/log/mysql/slow.log 2>/dev/null || echo 0)

# Get wp_options autoload size:
AUTOLOAD_MB=$(wp --path="$WP_PATH" db query \
    "SELECT ROUND(SUM(LENGTH(option_value))/1024/1024, 2) FROM wp_options WHERE autoload='yes';" \
    --skip-column-names 2>/dev/null || echo "N/A")

# Get wp_postmeta size:
POSTMETA_ROWS=$(wp --path="$WP_PATH" db query \
    "SELECT COUNT(*) FROM wp_postmeta;" \
    --skip-column-names 2>/dev/null || echo "N/A")

echo "$DATE | Slow queries: $SLOW_QUERIES | Autoload: ${AUTOLOAD_MB}MB | Postmeta rows: $POSTMETA_ROWS" \
    >> /var/log/wp-db-monitor.log
SCRIPT
chmod +x /usr/local/bin/wp-db-monitor.sh

# Add to crontab:
# 0 6 * * * /usr/local/bin/wp-db-monitor.sh
Part 13 — The Complete Optimization Checklist and Priority Order
Not all optimizations are equal. Here’s the correct order to apply them for maximum impact per hour of effort:
PHASE 1: FREE WINS (1–2 hours, massive impact)
──────────────────────────────────────────────────────────────────────
Priority  Action                                        Typical Gain
──────────────────────────────────────────────────────────────────────
1.        Enable MySQL slow query log                   Diagnostic only
2.        Install Query Monitor + record baseline       Diagnostic only
3.        Add Redis object cache (wp cache flush)       30–60% reduction
4.        Clean expired transients                      5–20% DB size
5.        Audit autoloaded options (fix > 1MB)          20–40% first request
6.        Add composite index on wp_postmeta            15–30% meta queries
7.        Enable OPcache (if not already)               20–50% PHP speed
──────────────────────────────────────────────────────────────────────

PHASE 2: CODE FIXES (2–8 hours, significant impact)
──────────────────────────────────────────────────────────────────────
8.        Fix N+1 queries in custom code/themes         40–80% query count
9.        Add no_found_rows=true where applicable       10–20% per loop
10.       Identify and replace LIKE queries in search   50–90% search speed
11.       Fix slow meta_queries (use custom SQL)        30–70% for meta queries
12.       Pre-load term and thumbnail caches            20–40% template speed
──────────────────────────────────────────────────────────────────────

PHASE 3: ARCHITECTURE (4–20 hours, major impact for high traffic)
──────────────────────────────────────────────────────────────────────
13.       Replace default search with Elasticsearch     90% search improvement
14.       Move transient-heavy code to custom tables    50–80% for those queries
15.       Implement persistent page cache (Nginx)       95% reduction for anon
16.       Move WooCommerce to dedicated DB server       30–50% for high volume
17.       Add CDN (static assets off-origin)            30–50% TTFB improvement
──────────────────────────────────────────────────────────────────────

ONGOING MAINTENANCE (monthly)
──────────────────────────────────────────────────────────────────────
□ Run OPTIMIZE TABLE on fragmented tables
□ Delete orphaned postmeta and usermeta
□ Clean expired transients
□ Audit new plugin queries via Query Monitor
□ Review slow query log for new issues
□ Check autoload size hasn't regrown
──────────────────────────────────────────────────────────────────────
The One-Click Database Cleanup Script
#!/bin/bash
# wp-db-cleanup.sh
# Run monthly: sudo bash wp-db-cleanup.sh /var/www/html

WP_PATH="${1:-/var/www/html}"

echo "Starting WordPress database cleanup..."
echo "Path: $WP_PATH"
echo ""

# 1. Delete expired transients:
echo "1. Cleaning expired transients..."
DELETED=$(wp --path="$WP_PATH" transient delete --expired --all 2>/dev/null | grep -oP '\d+' | head -1)
echo "   Deleted: ${DELETED:-0} expired transients"

# 2. Optimize database tables:
echo "2. Optimizing database tables..."
wp --path="$WP_PATH" db optimize 2>/dev/null
echo "   Done"

# 3. Delete orphaned postmeta:
echo "3. Removing orphaned postmeta..."
ORPHANED=$(wp --path="$WP_PATH" db query \
    "DELETE pm FROM wp_postmeta pm
     LEFT JOIN wp_posts p ON p.ID = pm.post_id
     WHERE p.ID IS NULL;" --skip-column-names 2>/dev/null)
echo "   Done"

# 4. Delete orphaned usermeta:
echo "4. Removing orphaned usermeta..."
wp --path="$WP_PATH" db query \
    "DELETE um FROM wp_usermeta um
     LEFT JOIN wp_users u ON u.ID = um.user_id
     WHERE u.ID IS NULL;" 2>/dev/null
echo "   Done"

# 5. Remove spam and trash:
echo "5. Emptying trash and spam..."
wp --path="$WP_PATH" post delete \
    $(wp --path="$WP_PATH" post list --post_status=trash --format=ids 2>/dev/null) \
    --force 2>/dev/null
echo "   Done"

# 6. Show final database size:
echo ""
echo "Database size after cleanup:"
wp --path="$WP_PATH" db size --tables 2>/dev/null | sort -k2 -rn | head -10

echo ""
echo "Cleanup complete!"
Database Performance Is a System, Not a Setting
The original article gives you a starting point: enable the slow query log, use Query Monitor, optimize tables, add an index. That’s the right beginning but these steps address symptoms. This guide addresses root causes.
The hierarchy of WordPress database performance, from most to least impactful:
- Architecture first — Is Redis installed as an object cache? Without it, transients live in the database and every repeat query hits MySQL.
- Autoload before indexes — A 5MB autoload payload slows down every request before a single business query runs. Fix this before anything else.
- N+1 patterns before query optimization — A query running 150 times is worse than one slow query. Fix the architecture before tuning the individual query.
- Indexes enable the optimizer — Once your queries are structured correctly, indexes make MySQL fast. Without correct query structure, indexes don’t help.
- Table maintenance enables indexes — Fragmented tables make indexes less effective. OPTIMIZE TABLE reclaims that efficiency.
Apply the fixes in the priority order from Part 13, measure after each change using the benchmarking approach from Part 12, and you will have a WordPress site where the database is no longer the bottleneck.
The sites that stay fast long-term aren’t the ones that applied the most optimization techniques. They’re the ones that set up monitoring (slow query log, Query Monitor baseline, monthly autoload checks) that catches new problems before they become crises.


